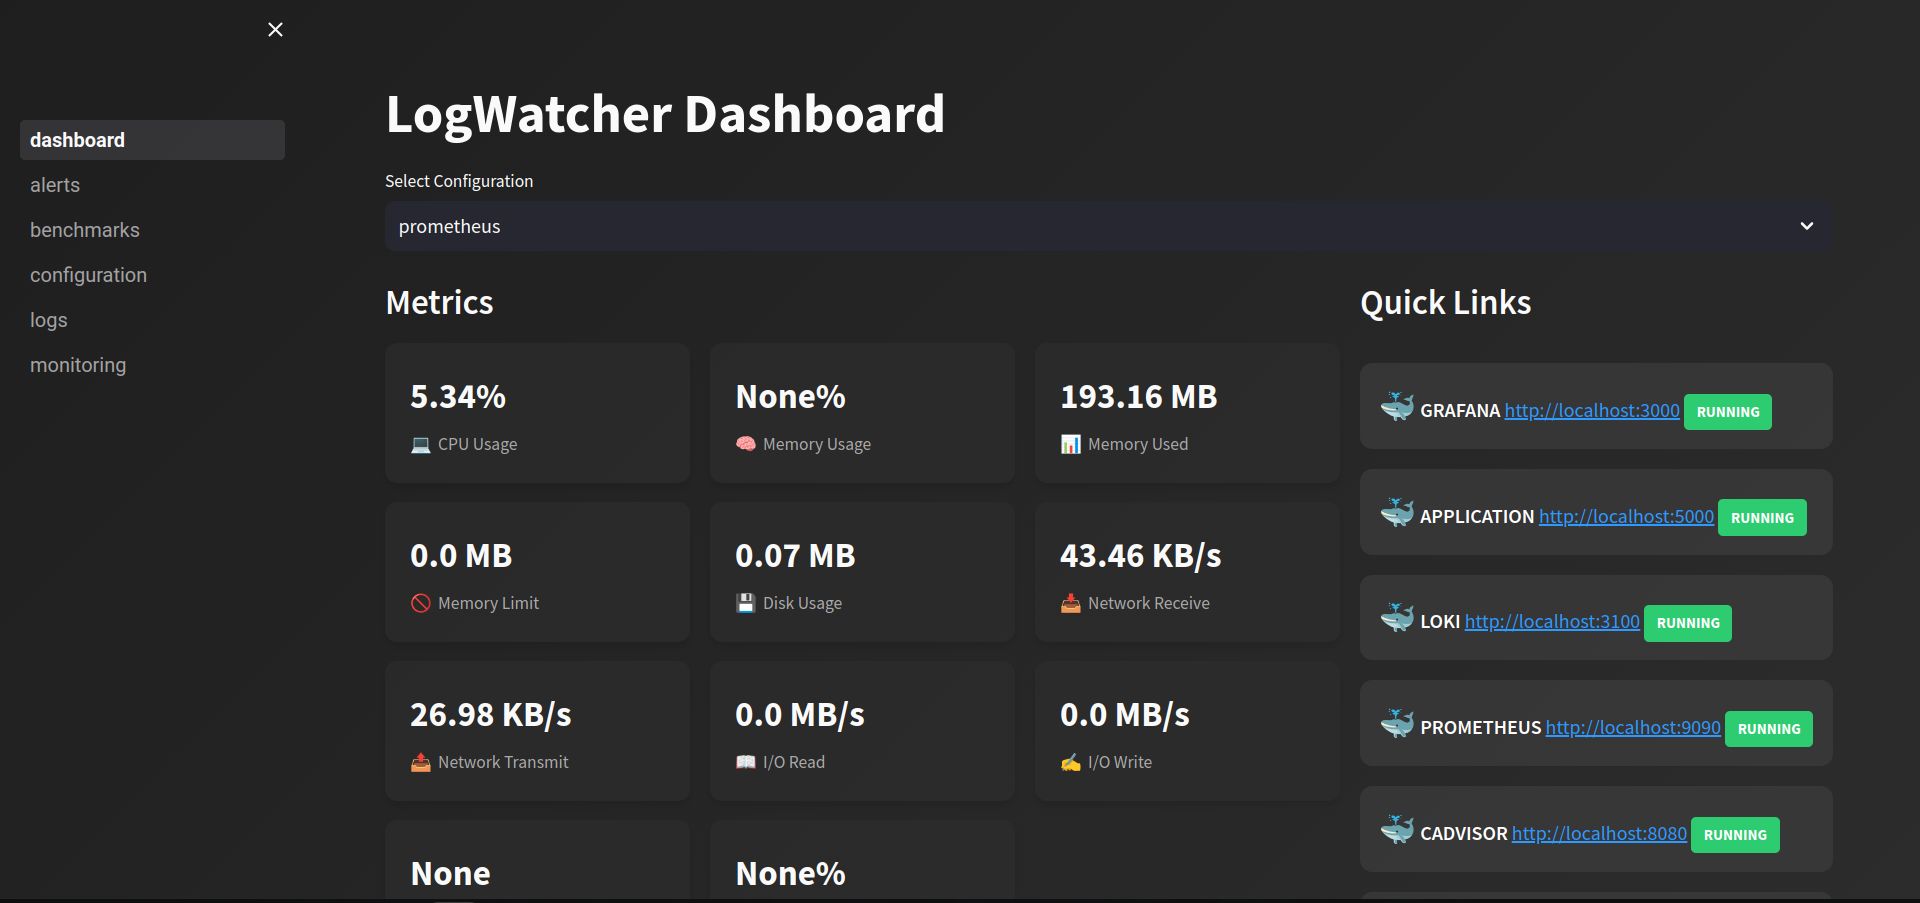
Figure 1 - LogWatcher dashboard
In this article, project created by Atakan G. will be discussed and pros and cons will be revealed.
Introducing LogWatcher
LogWatcher is an open source software tool, created by Atakan G to simplify application monitoring. The main purpose of this tool is to monitor and gain insights about a given docker image application.
Getting Started
NOTE: As of 31.07.2024, AtakanG7 is not publicly reachable. (flagged)
Clone the project:
git clone https://github.com/AtakanG7/logWatcher.gitRun the starter script:
sh logwatcher.sh your-docker-image-nameWait for the requirements to install. A Streamlit interface will pop up for interaction.
1-1 What is LogWatcher?
Using the CLI is powerful, but a GUI makes things simple. I value simplicity, so I built this to visualize metrics and optimize resource usage easily.
Open Source Philosophy and Benefits
I believe open source improves code quality when developers "measure twice, cut once."
Showing your skills to the community matters. I never hide mine. Nevermind!
1-2 Purpose and Benefits
LogWatcher is designed to be used as internal company software. It is useful for:
- Testing docker images
- Viewing total resource usage
- Seeing error logs in real time
- Observing alert patterns over time
Usually, setting up such a system requires deep knowledge of configuration management. LogWatcher abstracts this by bundling all necessary exporters and scrapers.
2-1 LogWatcher Architecture
LogWatcher follows a microservice architecture.
Each service is loosely coupled and independently scalable.
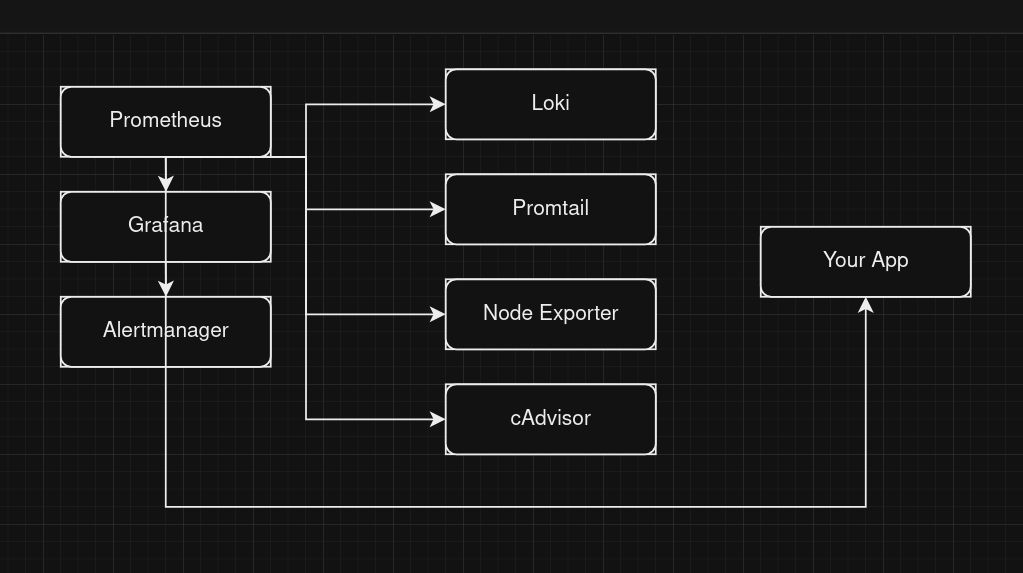
Figure 2 - LogWatcher system architecture
All services communicate over Docker's internal network using the HTTP/HTTPS protocol.
2-2 Technology
The goal is to build a user interface that monitors any docker image instantly with no manual configuration.
I chose Streamlit for fast and simple UI development.
Prometheus
An open-source metric scraper that collects data from registered targets with powerful querying.
Grafana
A flexible open-source visualization tool. It uses Prometheus data to build rich dashboards.
Alert Manager
Captures alerts from Prometheus and notifies via Email, Telegram, Discord, Slack, etc.
Loki & Promtail
Log collection stack for target containers. Feeds structured logs to Prometheus.
Node Exporter & cAdvisor
Collect system and docker container metrics for Prometheus.
3-1 LogWatcher Features
Key capabilities:
- ✅ Monitoring
- ✅ Alert System
- ✅ Benchmarking
- ✅ Configuration Management
- ✅ Real-time Logs
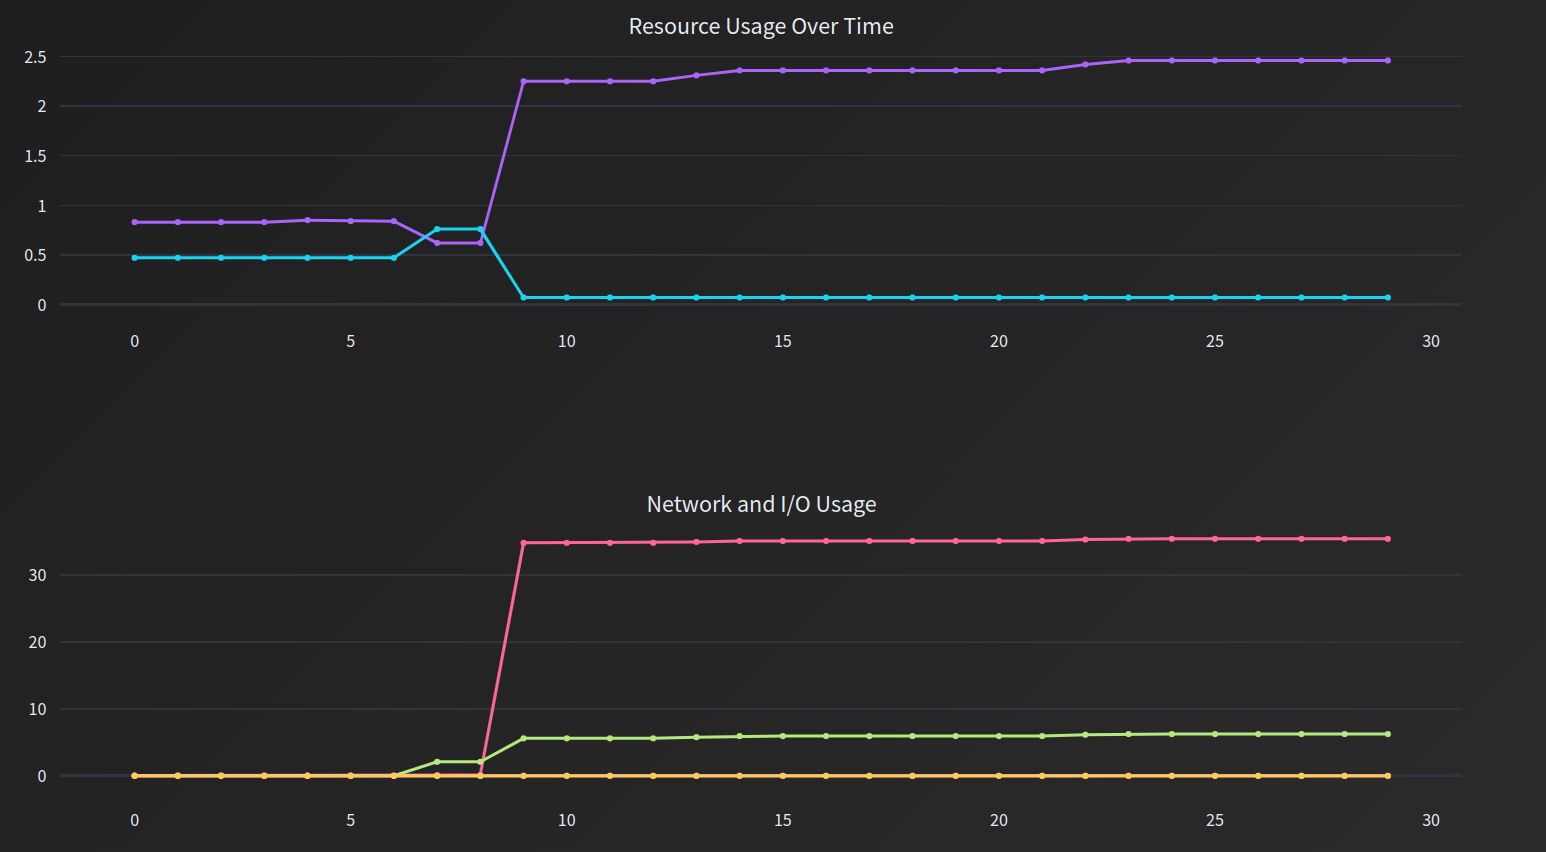
Figure 3 - LogWatcher monitoring center
Monitoring
Uses the stack above to track application metrics and display them via dashboard.
Alert System
Triggers alerts via Prometheus, sending messages to maintainers.
Benchmarking
Allows pre-deployment testing to reduce on-the-fly stress for developers.
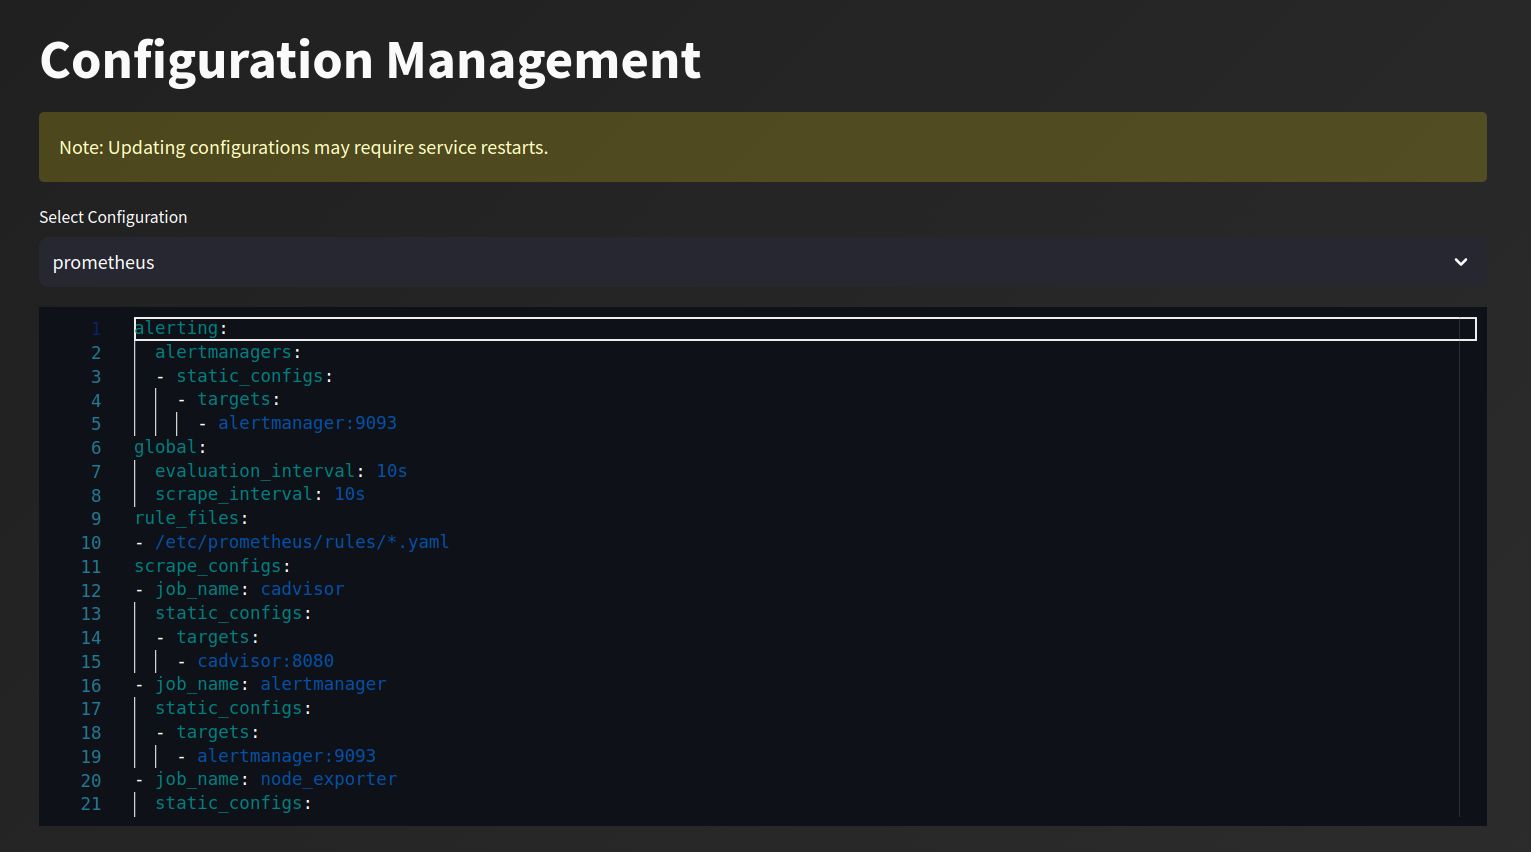
Figure 4 - Configuration management interface
Configuration Management
UI for editing config files without needing deep system knowledge.
Changes require container restart, which is handled automatically.
New containers in the monitoring network are auto-detected and start exporting metrics.

Figure 5 - Real-time log center
Real-time Logs
While Python’s docker module gives quick access to logs, it's not Prometheus-compatible.
Loki & Promtail make logs queryable and useful.
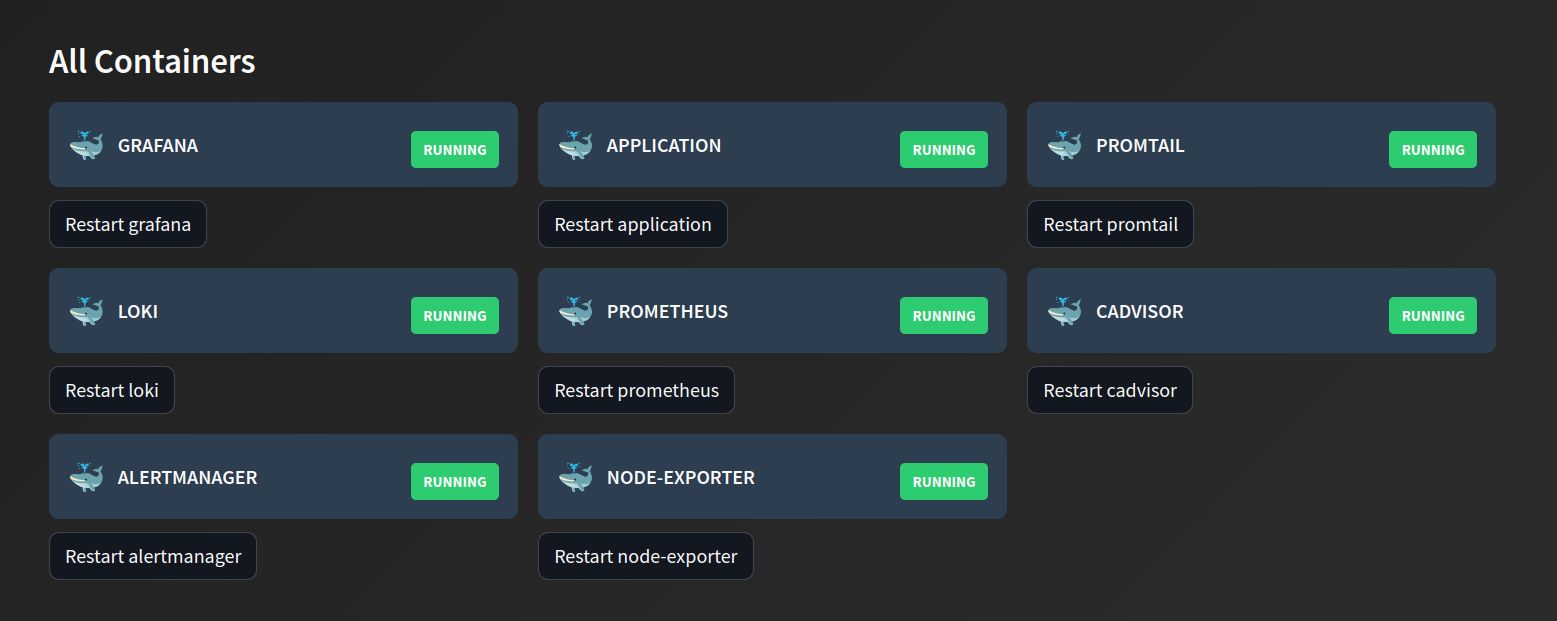
Figure 6 - Docker container management view
Dashboard allows full container access and control via the Docker API.
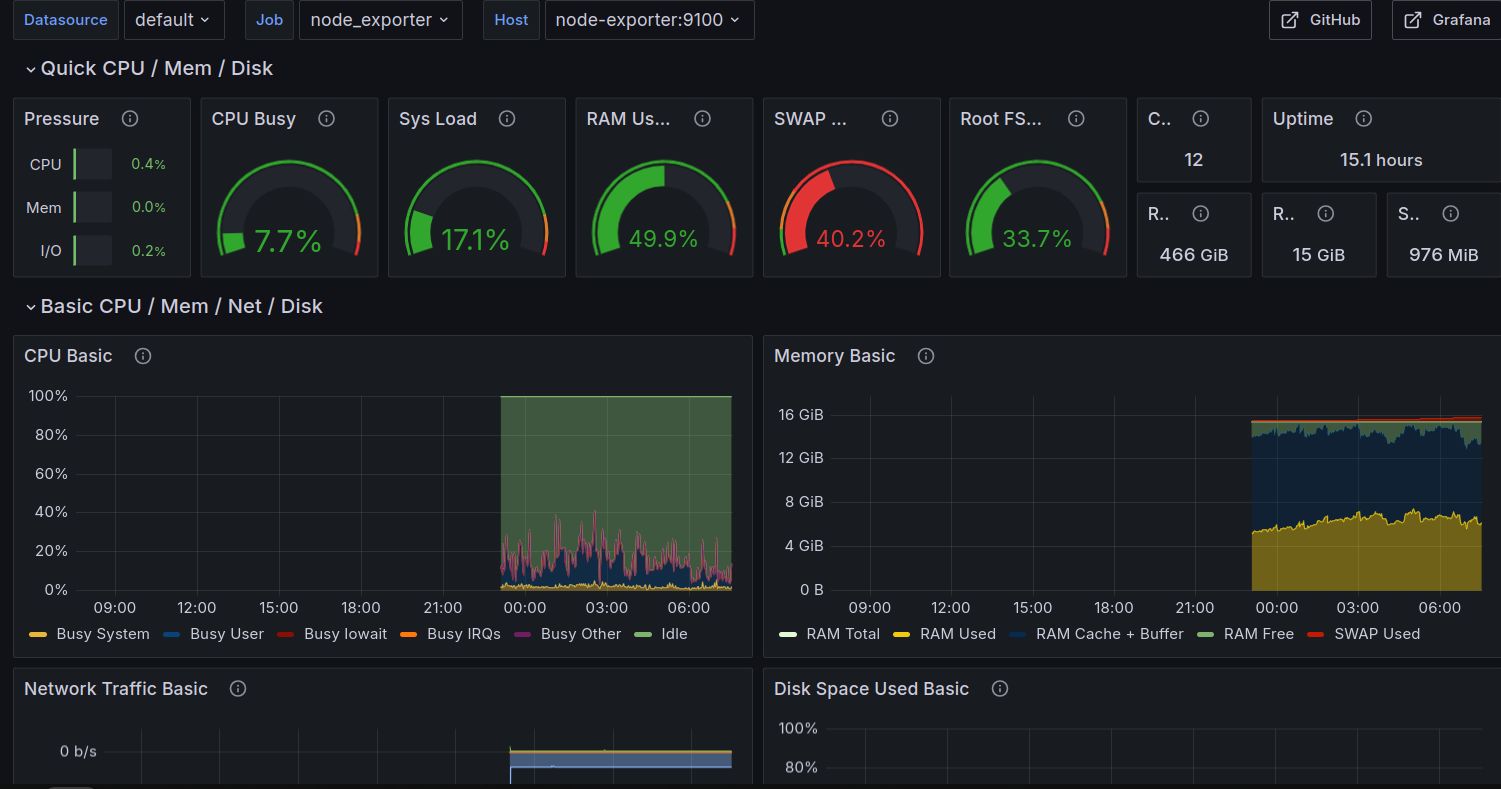
Figure 7 - Grafana node metrics
Grafana dashboards are pre-configured using JSON/YAML templates.
More dashboards at Grafana Dashboards
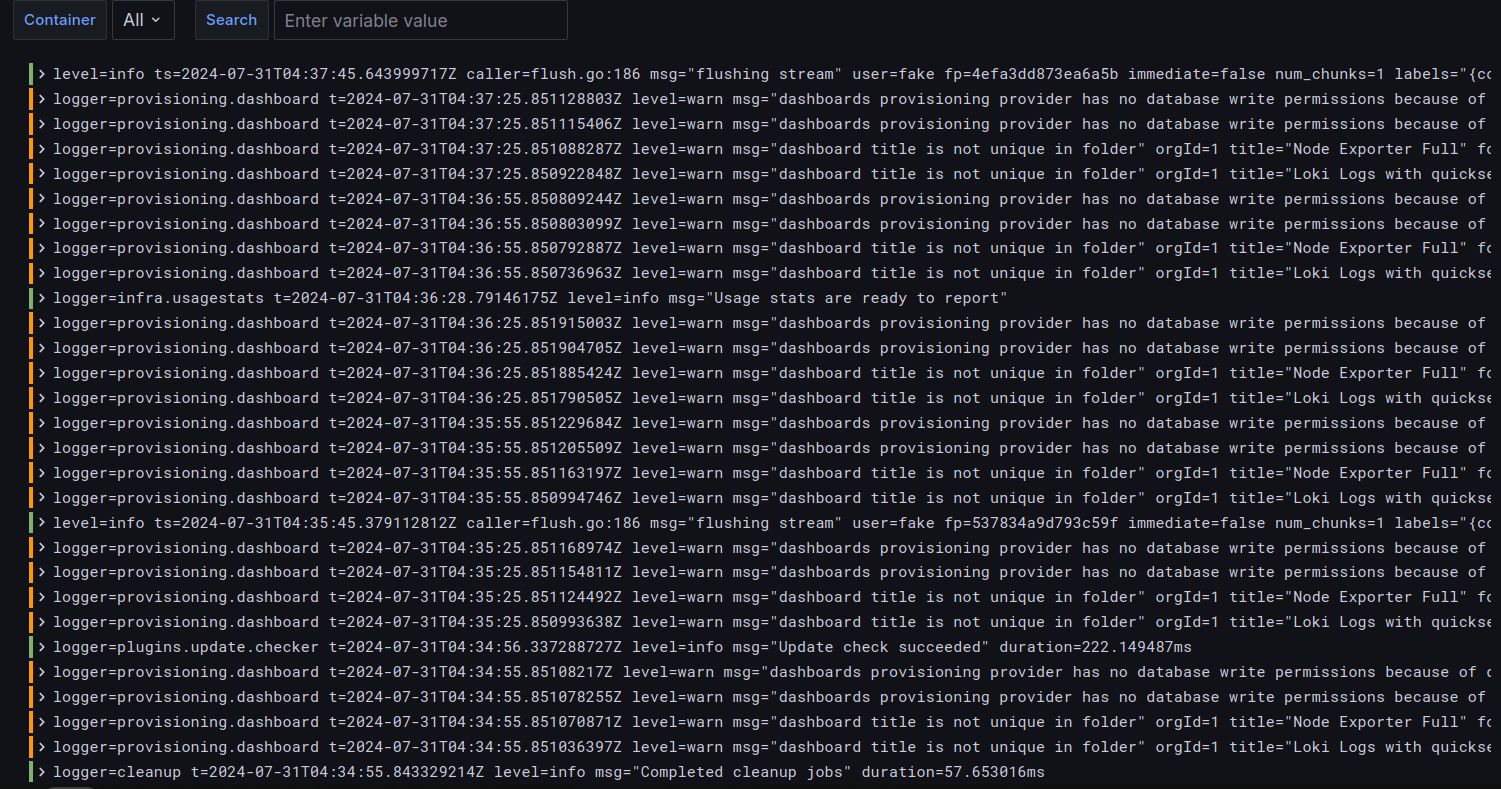
Figure 8 - Loki & Promtail metrics
Logs are labeled and prioritized for Prometheus and Grafana to act accordingly.
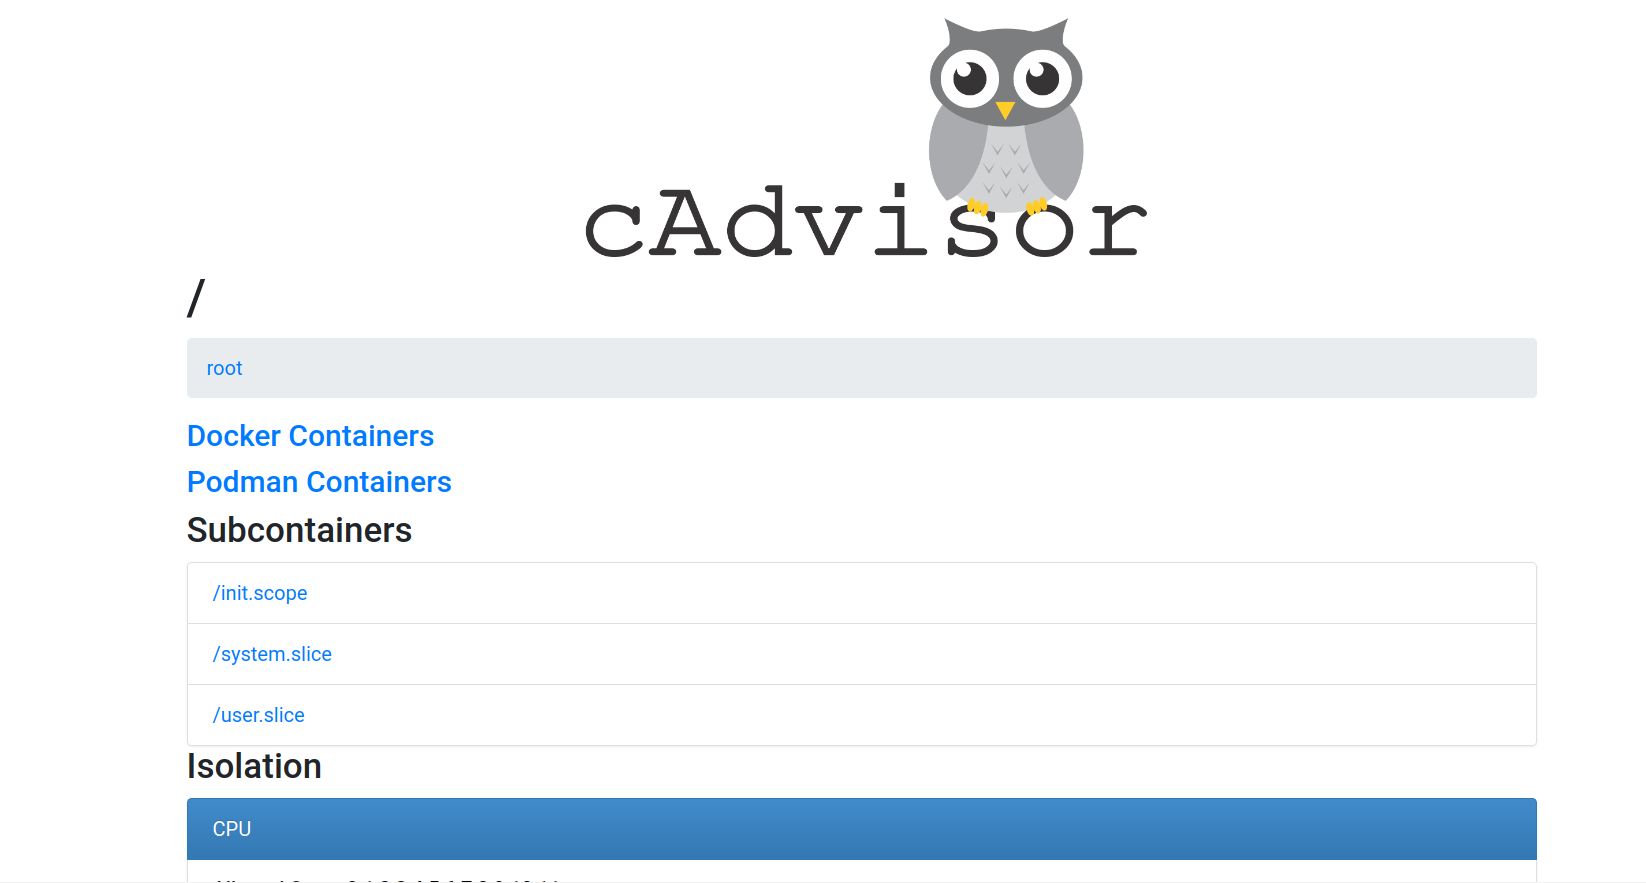
Figure 9 - cAdvisor dashboard
cAdvisor shows live container metrics at
http://localhost:8080/containers/
Conclusion
This project taught me a lot. I’m curious how people react.
If it gains attention, next steps are cloud integration and broader compatibility.
Thanks for exploring LogWatcher!
Best regards,
Atakan G.
If you like projects like this, feel free to subscribe to my newsletter — it’s free.
Resources
- https://www.techtarget.com/searchnetworking/definition/loose-coupling
- https://en.wikipedia.org/wiki/Microservices
- https://prometheus.io/docs/instrumenting/exporters/
- https://en.wikipedia.org/wiki/Configuration_management
- https://streamlit.io/
- https://www.cloudflare.com/learning/ssl/what-is-https/
- https://docs.docker.com/reference/cli/docker/image/ls/
- https://budibase.com/internal-tools/
- https://aws.amazon.com/what-is/cli/
- https://en.wikipedia.org/wiki/Graphical_user_interface
- https://www.techtarget.com/searchitoperations/definition/Docker-image
- https://grafana.com/grafana/dashboards/